Comparison of MCube results across multiple CRC datasets focusing on T cells
[1]:
set.seed(20250502)

library(Matrix)
library(spacexr)
library(MCube)
library(ggplot2)

palettes <- c("#32CD32", "#FF69B4")
[2]:
RAW_DATA_PATH <- "/import/home/share/zw/data/CRC"
DATA_PATH <- "/import/home/share/zw/pql/data/CRC"
RESULT_PATH <- "/import/home/share/zw/pql/results/CRC"

if (!dir.exists(file.path(RESULT_PATH, "Visium"))) {
    dir.create(file.path(RESULT_PATH, "Visium"), recursive = TRUE)
}
if (!dir.exists(file.path(RESULT_PATH, "VisiumHD"))) {
    dir.create(file.path(RESULT_PATH, "VisiumHD"), recursive = TRUE)
}
if (!dir.exists(file.path(RESULT_PATH, "Xenium"))) {
    dir.create(file.path(RESULT_PATH, "Xenium"), recursive = TRUE)
}
We then compare the results from MCube on different CRC datasets. We focus on the CD4+ T cells and CD8+ T cells to study the tumor microenvironment (TME).
[3]:
immune_celltypes <- c("CD4 T cell", "CD8 Cytotoxic T cell")
10x Visium
[4]:
tech <- "Visium"
Cell type deconvolution using RCTD
[5]:
myRCTD <- readRDS(file.path(RESULT_PATH, tech, "myRCTD.rds"))
weights_RCTD <- as.matrix(myRCTD@results$weights)
proportions_RCTD <- weights_RCTD / rowSums(weights_RCTD)
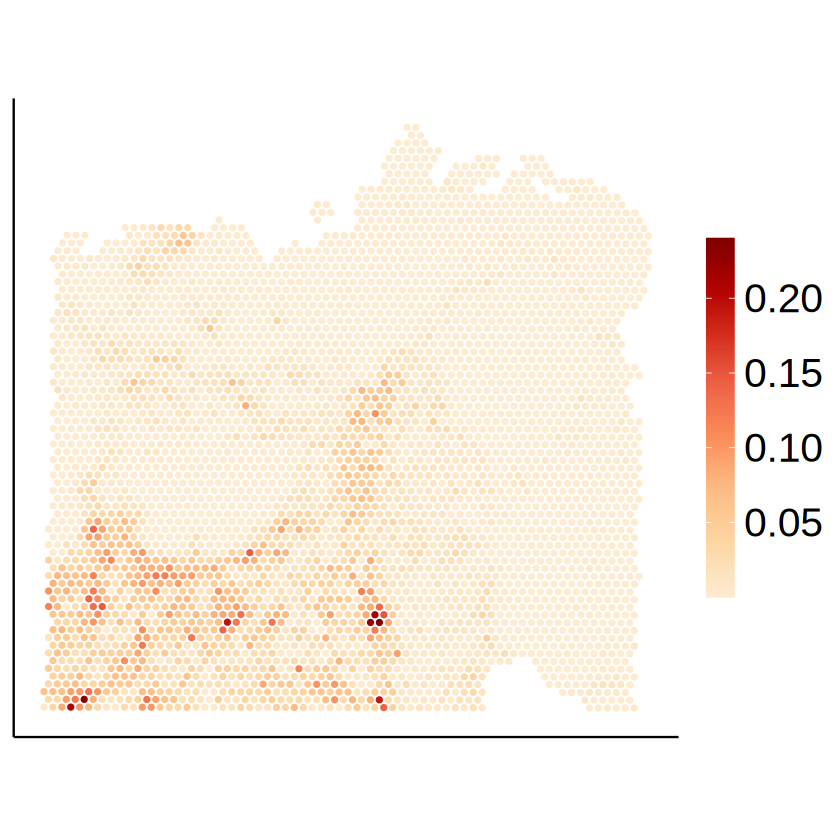
[6]:
for (celltype in immune_celltypes) {
    p <- mcubePlotPropCellType(
        proportions_RCTD, as.matrix(myRCTD@spatialRNA@coords), celltype
    ) + labs(title = NULL, x = NULL, y = NULL) +
        guides(color = guide_colorbar(barheight = 15)) +
        theme(
            axis.text = element_blank(),
            axis.ticks = element_blank(),
            legend.text = element_text(size = 24),
            legend.position = "right"
        )
    ggsave(
        filename = file.path(
            RESULT_PATH,
            paste0(tech, "_proportion_", celltype, ".pdf")
        ),
        plot = p, width = 7, height = 5
    )
    ggsave(
        filename = file.path(
            RESULT_PATH,
            paste0(tech, "_proportion_", celltype, ".png")
        ),
        plot = p, width = 7, height = 5
    )
}
p
10x Visium HD
[7]:
tech <- "VisiumHD"
Cell type deconvolution using RCTD
[8]:
myRCTD <- readRDS(file.path(RESULT_PATH, tech, "myRCTD_16um.rds"))
weights_RCTD <- as.matrix(myRCTD@results$weights)
proportions_RCTD <- weights_RCTD / rowSums(weights_RCTD)
[9]:
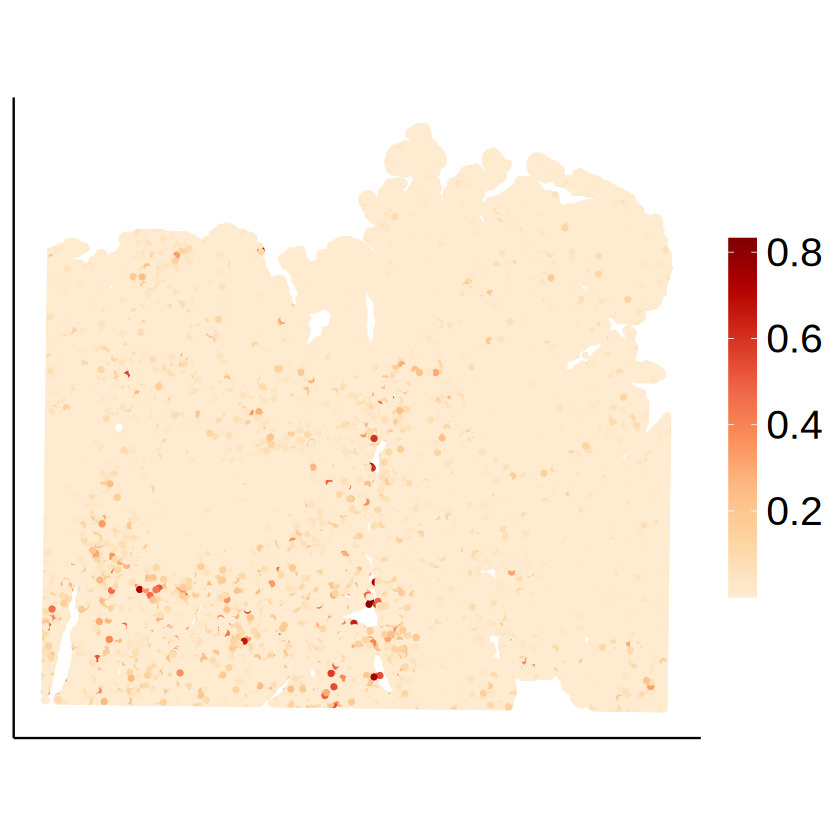
for (celltype in immune_celltypes) {
    p <- mcubePlotPropCellType(
        proportions_RCTD, as.matrix(myRCTD@spatialRNA@coords),
        celltype,
        spot_size = 1
    ) + labs(title = NULL, x = NULL, y = NULL) +
        guides(color = guide_colorbar(barheight = 15)) +
        theme(
            plot.title = element_text(size = 24, hjust = 0.5),
            axis.text = element_blank(),
            axis.ticks = element_blank(),
            legend.text = element_text(size = 24),
            legend.position = "right"
        )
    ggsave(
        filename = file.path(
            RESULT_PATH,
            paste0(tech, "_proportion_", celltype, ".pdf")
        ),
        plot = p, width = 7, height = 5
    )
    ggsave(
        filename = file.path(
            RESULT_PATH,
            paste0(tech, "_proportion_", celltype, ".png")
        ),
        plot = p, width = 7, height = 5
    )
}
p
Cell-type-specific SVG identification using MCube
[10]:
weights_RCTD <- as.matrix(myRCTD@results$weights)
proportions_RCTD <- weights_RCTD / rowSums(weights_RCTD)
spot_effects_RCTD <- log(rowSums(weights_RCTD))
names(spot_effects_RCTD) <- rownames(weights_RCTD)
doublet_results_RCTD <- myRCTD@results$results_df
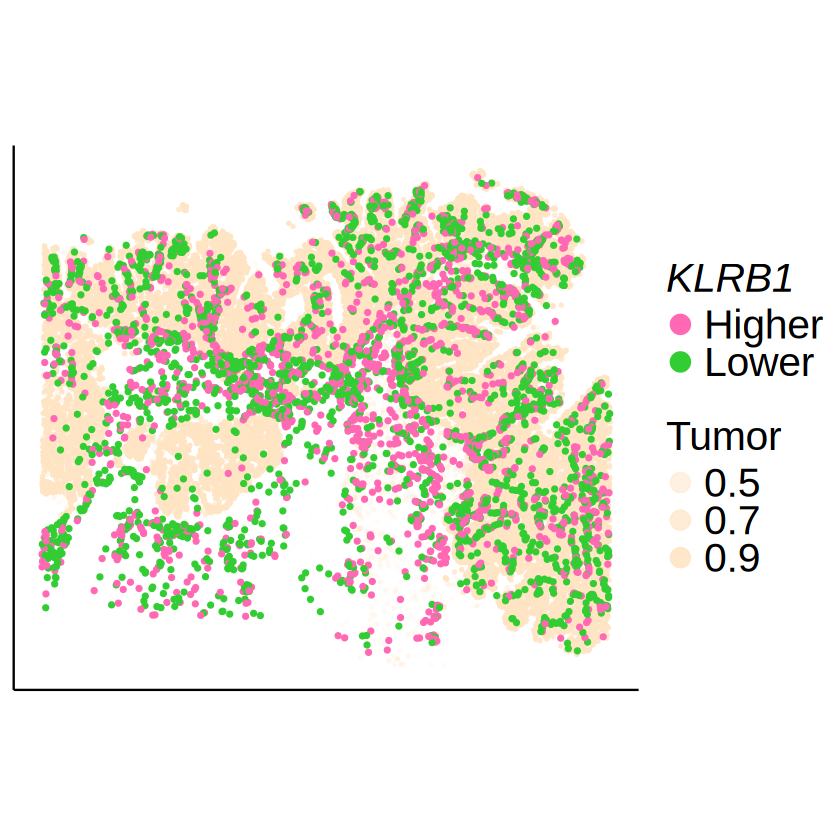
KLRB1 in CD4+ T cell
[11]:
celltype <- immune_celltypes[1]
gene <- "KLRB1"
[12]:
mcube_object <- readRDS(
    file.path(
        RESULT_PATH, tech,
        paste0("mcube_", celltype, ".rds")
    )
)
mcube_object@pvalues[[celltype]][gene, ]
| linear | Gaussian_1 | Gaussian_2 | Gaussian_transformed_1 | Gaussian_transformed_2 | combined_pvalue | |
|---|---|---|---|---|---|---|
| <dbl> | <dbl> | <dbl> | <dbl> | <dbl> | <dbl> | |
| KLRB1 | 0.6554415 | 2.028479e-07 | 6.329989e-10 | 0.3295828 | 0.2393012 | 3.155149e-09 |
[13]:
null_model_results <- mcube_object@null_models[[paste0(celltype, "_", gene)]]

spots_target <- null_model_results$spots
expr_level <- null_model_results$u[spots_target, celltype]
expr_level <- factor(ifelse(expr_level >= 0, "Higher", "Lower"))
target_df <- data.frame(
    x = mcube_object@coordinates[spots_target, 1],
    y = mcube_object@coordinates[spots_target, 2],
    expr_level = expr_level
)

spots_background <- setdiff(rownames(proportions_RCTD), spots_target)
tumor_df <- cbind(
    myRCTD@spatialRNA@coords[spots_background, ],
    Tumor = proportions_RCTD[spots_background, "Tumor III"]
)
tumor_df <- tumor_df[sample(1:nrow(tumor_df), 30000), ]

p <- ggplot() +
    geom_point(
        data = tumor_df,
        aes(x = x, y = y, alpha = Tumor),
        color = "bisque", size = 0.5
    ) +
    geom_point(
        data = target_df,
        aes(x = x, y = y, color = expr_level),
        size = 1, alpha = 1
    ) +
    scale_color_manual(
    #   name = bquote(italic(.(gene)) ~ "expression"),
        name = bquote(italic(.(gene))),
      values = c("Lower" = palettes[1], "Higher" = palettes[2])
    ) +
    scale_alpha_continuous(
        name = "Tumor",
        range = c(0, 1),
        breaks = c(0.5, 0.7, 0.9)
    ) +
    guides(
        color = guide_legend(
            order = 1, override.aes = list(size = 5)),
        alpha = guide_legend(order = 2, override.aes = list(size = 5))
    ) +
    scale_y_continuous(trans = "reverse") +
        coord_fixed(ratio = 1) +
        labs(title = NULL, x = NULL, y = NULL) +
        theme_classic() +
        theme(
            text = element_text(family = "Helvetica"),
            axis.text = element_blank(),
            axis.ticks = element_blank(),
            legend.title = element_text(size = 24),
            legend.text = element_text(size = 24),
            legend.position = "right"
        )
ggsave(
    filename = file.path(
        RESULT_PATH,
        paste0(tech, "_", celltype, "_", gene, ".pdf")
    ),
    plot = p, width = 7, height = 5
)
ggsave(
    filename = file.path(
        RESULT_PATH,
        paste0(tech, "_", celltype, "_", gene, ".png")
    ),
    plot = p, width = 7, height = 5
)
p

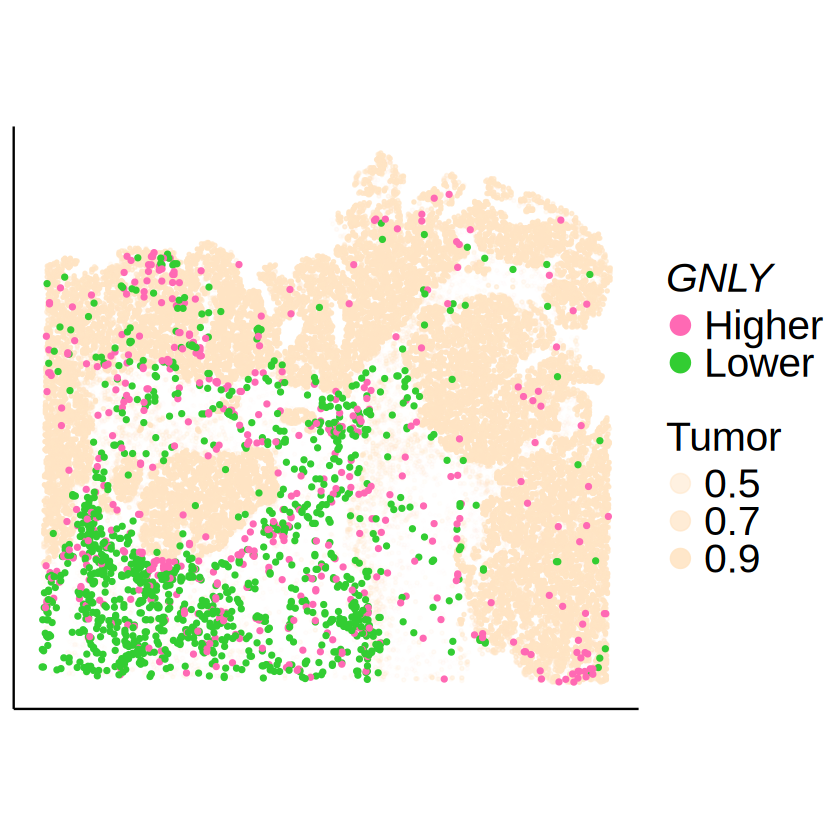
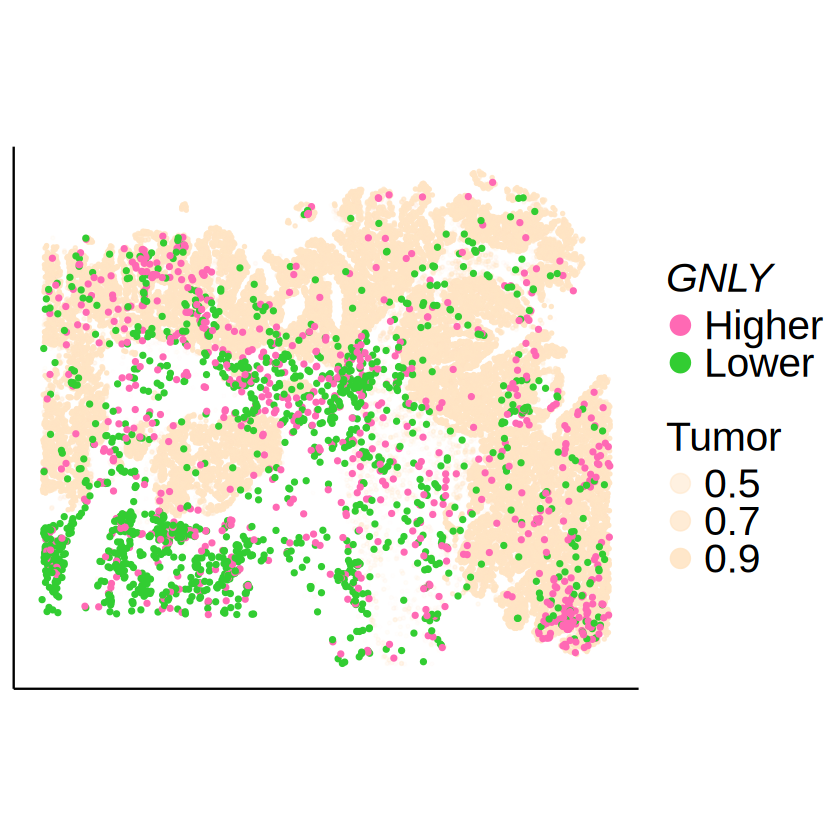
GNLY in CD8+ Cytotoxic T cell
[14]:
celltype <- "CD8 Cytotoxic T cell"
gene <- "GNLY"
[15]:
mcube_object <- readRDS(
    file.path(
        RESULT_PATH, tech,
        paste0("mcube_", celltype, ".rds")
    )
)
mcube_object@pvalues[[celltype]][gene, ]
| linear | Gaussian_1 | Gaussian_2 | Gaussian_transformed_1 | Gaussian_transformed_2 | combined_pvalue | |
|---|---|---|---|---|---|---|
| <dbl> | <dbl> | <dbl> | <dbl> | <dbl> | <dbl> | |
| GNLY | 1.198134e-11 | 5.41254e-10 | 6.373048e-14 | 0.8144249 | 0.7653016 | 3.170797e-13 |
[16]:
null_model_results <- mcube_object@null_models[[paste0(celltype, "_", gene)]]

spots_target <- null_model_results$spots
expr_level <- null_model_results$u[spots_target, celltype]
expr_level <- factor(ifelse(expr_level >= 0, "Higher", "Lower"))
target_df <- data.frame(
    x = mcube_object@coordinates[spots_target, 1],
    y = mcube_object@coordinates[spots_target, 2],
    expr_level = expr_level
)

spots_background <- setdiff(rownames(proportions_RCTD), spots_target)
tumor_df <- cbind(
    myRCTD@spatialRNA@coords[spots_background, ],
    Tumor = proportions_RCTD[spots_background, "Tumor III"]
)
tumor_df <- tumor_df[sample(1:nrow(tumor_df), 30000), ]

p <- ggplot() +
    geom_point(
        data = tumor_df,
        aes(x = x, y = y, alpha = Tumor),
        color = "bisque", size = 0.5
    ) +
    geom_point(
        data = target_df,
        aes(x = x, y = y, color = expr_level),
        size = 1, alpha = 1
    ) +
    scale_color_manual(
      #   name = bquote(italic(.(gene)) ~ "expression"),
      name = bquote(italic(.(gene))),
      values = c("Lower" = palettes[1], "Higher" = palettes[2])
    ) +
    scale_alpha_continuous(
        name = "Tumor",
        range = c(0, 1),
        breaks = c(0.5, 0.7, 0.9)
    ) +
    guides(
        color = guide_legend(
            order = 1, override.aes = list(size = 5)),
        alpha = guide_legend(order = 2, override.aes = list(size = 5))
    ) +
    scale_y_continuous(trans = "reverse") +
        coord_fixed(ratio = 1) +
        labs(title = NULL, x = NULL, y = NULL) +
        theme_classic() +
        theme(
            text = element_text(family = "Helvetica"),
            axis.text = element_blank(),
            axis.ticks = element_blank(),
            legend.title = element_text(size = 24),
            legend.text = element_text(size = 24),
            legend.position = "right"
        )
ggsave(
    filename = file.path(
        RESULT_PATH,
        paste0(tech, "_", celltype, "_", gene, ".pdf")
    ),
    plot = p, width = 7, height = 5
)
ggsave(
    filename = file.path(
        RESULT_PATH,
        paste0(tech, "_", celltype, "_", gene, ".png")
    ),
    plot = p, width = 7, height = 5
)
p
10x Xenium
[17]:
tech <- "Xenium"
Cell type deconvolution using RCTD
[18]:
myRCTD <- readRDS(file.path(RESULT_PATH, tech, "myRCTD.rds"))
weights_RCTD <- as.matrix(myRCTD@results$weights)
proportions_RCTD <- weights_RCTD / rowSums(weights_RCTD)
[19]:
for (celltype in immune_celltypes) {
    p <- mcubePlotPropCellType(
        proportions_RCTD, as.matrix(myRCTD@spatialRNA@coords),
        celltype,
        spot_size = 1
    ) + labs(title = NULL, x = NULL, y = NULL) +
        guides(color = guide_colorbar(barheight = 15)) +
        theme(
            plot.title = element_text(size = 24, hjust = 0.5),
            axis.text = element_blank(),
            axis.ticks = element_blank(),
            legend.text = element_text(size = 24),
            legend.position = "right"
        )
    ggsave(
        filename = file.path(
            RESULT_PATH,
            paste0(tech, "_proportion_", celltype, ".pdf")
        ),
        plot = p, width = 7, height = 5
    )
    ggsave(
        filename = file.path(
            RESULT_PATH,
            paste0(tech, "_proportion_", celltype, ".png")
        ),
        plot = p, width = 7, height = 5
    )
}
p
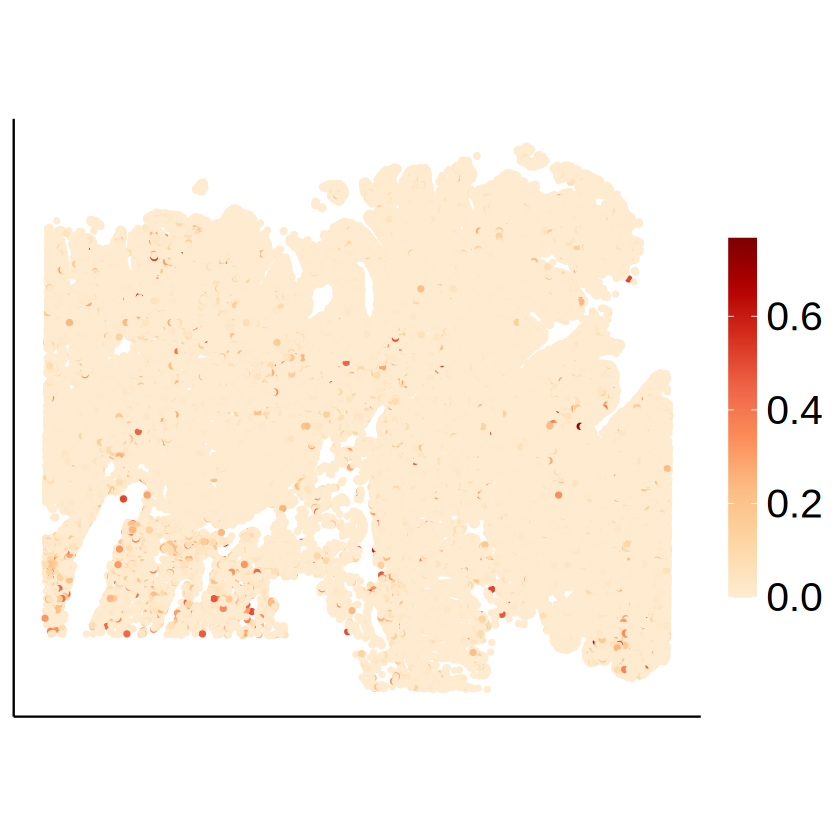
Cell-type-specific SVG identification using MCube
[20]:
weights_RCTD <- as.matrix(myRCTD@results$weights)
proportions_RCTD <- weights_RCTD / rowSums(weights_RCTD)
spot_effects_RCTD <- log(rowSums(weights_RCTD))
names(spot_effects_RCTD) <- rownames(weights_RCTD)
doublet_results_RCTD <- myRCTD@results$results_df
KLRB1 in CD4+ T cell
[21]:
celltype <- immune_celltypes[1]
gene <- "KLRB1"
[22]:
mcube_object <- readRDS(
    file.path(
        RESULT_PATH, tech,
        paste0("mcube_", celltype, ".rds")
    )
)
mcube_object@pvalues[[celltype]][gene, ]
| linear | Gaussian_1 | Gaussian_2 | Gaussian_transformed_1 | Gaussian_transformed_2 | combined_pvalue | |
|---|---|---|---|---|---|---|
| <dbl> | <dbl> | <dbl> | <dbl> | <dbl> | <dbl> | |
| KLRB1 | 0.1773755 | 5.917171e-19 | 3.343736e-25 | 0.002749541 | 0.000984393 | 3.343736e-25 |
[23]:
null_model_results <- mcube_object@null_models[[paste0(celltype, "_", gene)]]

spots_target <- null_model_results$spots
expr_level <- null_model_results$u[spots_target, celltype]
expr_level <- factor(ifelse(expr_level >= 0, "Higher", "Lower"))
target_df <- data.frame(
    x = mcube_object@coordinates[spots_target, 1],
    y = mcube_object@coordinates[spots_target, 2],
    expr_level = expr_level
)

spots_background <- setdiff(rownames(proportions_RCTD), spots_target)
tumor_df <- cbind(
    myRCTD@spatialRNA@coords[spots_background, ],
    Tumor = proportions_RCTD[spots_background, "Tumor III"]
)
tumor_df <- tumor_df[sample(1:nrow(tumor_df), 30000), ]

p <- ggplot() +
    geom_point(
        data = tumor_df,
        aes(x = x, y = y, alpha = Tumor),
        color = "bisque", size = 0.5
    ) +
    geom_point(
        data = target_df,
        aes(x = x, y = y, color = expr_level),
        size = 1, alpha = 1
    ) +
    scale_color_manual(
      #   name = bquote(italic(.(gene)) ~ "expression"),
      name = bquote(italic(.(gene))),
      values = c("Lower" = palettes[1], "Higher" = palettes[2])
    ) +
    scale_alpha_continuous(
        name = "Tumor",
        range = c(0, 1),
        breaks = c(0.5, 0.7, 0.9)
    ) +
    guides(
        color = guide_legend(
            override.aes = list(size = 5)),
        alpha = guide_legend(override.aes = list(size = 5))
    ) +
    scale_y_continuous(trans = "reverse") +
        coord_fixed(ratio = 1) +
        labs(title = NULL, x = NULL, y = NULL) +
        theme_classic() +
        theme(
            text = element_text(family = "Helvetica"),
            axis.text = element_blank(),
            axis.ticks = element_blank(),
            legend.title = element_text(size = 18),
            legend.text = element_text(size = 24),
            legend.position = "right"
        )
ggsave(
    filename = file.path(
        RESULT_PATH,
        paste0(tech, "_", celltype, "_", gene, ".pdf")
    ),
    plot = p, width = 7, height = 5
)
ggsave(
    filename = file.path(
        RESULT_PATH,
        paste0(tech, "_", celltype, "_", gene, ".png")
    ),
    plot = p, width = 7, height = 5
)
pnull_model_results <- mcube_object@null_models[[paste0(celltype, "_", gene)]]

spots_target <- null_model_results$spots
expr_level <- null_model_results$u[spots_target, celltype]
expr_level <- factor(ifelse(expr_level >= 0, "Higher", "Lower"))
target_df <- data.frame(
    x = mcube_object@coordinates[spots_target, 1],
    y = mcube_object@coordinates[spots_target, 2],
    expr_level = expr_level
)

spots_background <- setdiff(rownames(proportions_RCTD), spots_target)
tumor_df <- cbind(
    myRCTD@spatialRNA@coords[spots_background, ],
    Tumor = proportions_RCTD[spots_background, "Tumor III"]
)
tumor_df <- tumor_df[sample(1:nrow(tumor_df), 30000), ]

p <- ggplot() +
    geom_point(
        data = tumor_df,
        aes(x = x, y = y, alpha = Tumor),
        color = "bisque", size = 0.5
    ) +
    geom_point(
        data = target_df,
        aes(x = x, y = y, color = expr_level),
        size = 1, alpha = 1
    ) +
    scale_color_manual(
      #   name = bquote(italic(.(gene)) ~ "expression"),
      name = bquote(italic(.(gene))),
      values = c("Lower" = palettes[1], "Higher" = palettes[2])
    ) +
    scale_alpha_continuous(
        name = "Tumor",
        range = c(0, 1),
        breaks = c(0.5, 0.7, 0.9)
    ) +
    guides(
        color = guide_legend(
            order = 1, override.aes = list(size = 5)),
        alpha = guide_legend(order = 2, override.aes = list(size = 5))
    ) +
    scale_y_continuous(trans = "reverse") +
        coord_fixed(ratio = 1) +
        labs(title = NULL, x = NULL, y = NULL) +
        theme_classic() +
        theme(
            text = element_text(family = "Helvetica"),
            axis.text = element_blank(),
            axis.ticks = element_blank(),
            legend.title = element_text(size = 24),
            legend.text = element_text(size = 24),
            legend.position = "right"
        )
ggsave(
    filename = file.path(
        RESULT_PATH,
        paste0(tech, "_", celltype, "_", gene, ".pdf")
    ),
    plot = p, width = 7, height = 5
)
ggsave(
    filename = file.path(
        RESULT_PATH,
        paste0(tech, "_", celltype, "_", gene, ".png")
    ),
    plot = p, width = 7, height = 5
)
p
GNLY in CD8+ Cytotoxic T cell
[24]:
celltype <- "CD8 Cytotoxic T cell"
gene <- "GNLY"
[25]:
mcube_object <- readRDS(
    file.path(
        RESULT_PATH, tech,
        paste0("mcube_", celltype, ".rds")
    )
)
mcube_object@pvalues[[celltype]][gene, ]
| linear | Gaussian_1 | Gaussian_2 | Gaussian_transformed_1 | Gaussian_transformed_2 | combined_pvalue | |
|---|---|---|---|---|---|---|
| <dbl> | <dbl> | <dbl> | <dbl> | <dbl> | <dbl> | |
| GNLY | 8.876639e-26 | 4.518422e-46 | 1.832016e-63 | 0.08656896 | 0.066333 | 1.832016e-63 |
[26]:
null_model_results <- mcube_object@null_models[[paste0(celltype, "_", gene)]]

spots_target <- null_model_results$spots
expr_level <- null_model_results$u[spots_target, celltype]
expr_level <- factor(ifelse(expr_level >= 0, "Higher", "Lower"))
target_df <- data.frame(
    x = mcube_object@coordinates[spots_target, 1],
    y = mcube_object@coordinates[spots_target, 2],
    expr_level = expr_level
)

spots_background <- setdiff(rownames(proportions_RCTD), spots_target)
tumor_df <- cbind(
    myRCTD@spatialRNA@coords[spots_background, ],
    Tumor = proportions_RCTD[spots_background, "Tumor III"]
)
tumor_df <- tumor_df[sample(1:nrow(tumor_df), 30000), ]

p <- ggplot() +
    geom_point(
        data = tumor_df,
        aes(x = x, y = y, alpha = Tumor),
        color = "bisque", size = 0.5
    ) +
    geom_point(
        data = target_df,
        aes(x = x, y = y, color = expr_level),
        size = 1, alpha = 1
    ) +
    scale_color_manual(
      #   name = bquote(italic(.(gene)) ~ "expression"),
      name = bquote(italic(.(gene))),
      values = c("Lower" = palettes[1], "Higher" = palettes[2])
    ) +
    scale_alpha_continuous(
        name = "Tumor",
        range = c(0, 1),
        breaks = c(0.5, 0.7, 0.9)
    ) +
    guides(
        color = guide_legend(
            order = 1, override.aes = list(size = 5)),
        alpha = guide_legend(order = 2, override.aes = list(size = 5))
    ) +
    scale_y_continuous(trans = "reverse") +
        coord_fixed(ratio = 1) +
        labs(title = NULL, x = NULL, y = NULL) +
        theme_classic() +
        theme(
            text = element_text(family = "Helvetica"),
            axis.text = element_blank(),
            axis.ticks = element_blank(),
            legend.title = element_text(size = 24),
            legend.text = element_text(size = 24),
            legend.position = "right"
        )
ggsave(
    filename = file.path(
        RESULT_PATH,
        paste0(tech, "_", celltype, "_", gene, ".pdf")
    ),
    plot = p, width = 7, height = 5
)
ggsave(
    filename = file.path(
        RESULT_PATH,
        paste0(tech, "_", celltype, "_", gene, ".png")
    ),
    plot = p, width = 7, height = 5
)
p
[ ]: