Applying MCube to the rotated dataset
[1]:
set.seed(20240709)

library(MCube)
library(ggplot2)

max_cores <- 36
[2]:
DATA_PATH <- "/import/home/share/zw/pql/data/mouse_brain"
RESULT_PATH <- "/import/home/share/zw/pql/results/mouse_brain"

if (!dir.exists(file.path(RESULT_PATH, "visium_1"))) {
    dir.create(file.path(RESULT_PATH, "visium_1"), recursive = TRUE)
}
if (!dir.exists(file.path(RESULT_PATH, "visium_2"))) {
    dir.create(file.path(RESULT_PATH, "visium_2"), recursive = TRUE)
}
if (!dir.exists(file.path(RESULT_PATH, "ST_3D"))) {
    dir.create(file.path(RESULT_PATH, "ST_3D"), recursive = TRUE)
}
Visium Slice 1
[3]:
# reference_ST <- data.matrix(read.csv(
#     file.path(DATA_PATH, "visium_1", "reference_ST.csv"),
#     header = TRUE, row.names = 1, check.names = FALSE
# ))
# dim(reference_ST)
# num_celltypes <- nrow(reference_ST)

# proportions_ST <- data.matrix(read.csv(
#     file.path(DATA_PATH, "visium_1", paste0("prop_slice", 0, ".csv")),
#     header = TRUE, row.names = 1, check.names = FALSE
# ))
# dim(proportions_ST)

# counts <- as.data.frame(readr::read_csv(
#     file.path(DATA_PATH, "visium_1", "counts.csv")
# ))
# rownames(counts) <- counts[, 1]
# counts[, 1] <- NULL
# counts <- data.matrix(counts)
# dim(counts)

# coordinates <- data.matrix(read.csv(
#     file.path(DATA_PATH, "visium_1", "3D_coordinates.csv"),
#     header = TRUE, row.names = 1, check.names = FALSE
# ))[, c("x", "y")]
# dim(coordinates)

# spot_effects_ST <- data.matrix(read.csv(
#     file.path(DATA_PATH, "visium_1", "spot_effects_ST.csv"),
#     header = TRUE, row.names = 1, check.names = FALSE
# ))[, 1]

# library_sizes_ST <- data.matrix(read.csv(
#     file.path(DATA_PATH, "visium_1", "library_sizes_ST.csv"),
#     header = TRUE, row.names = 1, check.names = FALSE
# ))[, 1]
[4]:
# # Real case

# mcube_object_1 <- createMCube(
#     counts = counts, coordinates = coordinates,
#     proportions = proportions_ST, library_sizes = library_sizes_ST,
#     covariates = NULL,
#     reference = reference_ST,
#     spot_effects = spot_effects_ST, platform_effects = NULL,
#     project = "mouse_brain_visium_1"
# )
# mcube_object_1 <- mcubeFitNull(
#     mcube_object_1,
#     num_workers = 70, num_threads = 1
# )
# mcube_object_1 <- mcubeTest(
#     mcube_object_1,
#     num_workers = 70, num_threads = 1, shared_memory = TRUE
# )
# saveRDS(
#     mcube_object_1,
#     file = file.path(
#         RESULT_PATH, "visium_1",
#         paste0("mcube", ".rds")
#     )
# )
mcube_object_1 <- readRDS(
    file = file.path(
        RESULT_PATH, "visium_1",
        paste0("mcube", ".rds")
    )
)
[5]:
# Rotate 45 degree

degrees <- 45
coordinates_rotation <- mcube_object_1@coordinates %*% rotation_matrix_2d(degrees)
rownames(coordinates_rotation) <- rownames(mcube_object_1@coordinates)
mcube_object_1_rotation <- mcube_object_1
mcube_object_1_rotation@coordinates <- coordinates_rotation

mcube_object_1_rotation <- mcubeTest(
    mcube_object_1_rotation,
    num_workers = 70, num_threads = 1, shared_memory = TRUE
)
pvalues_1_rotation <- mcube_object_1_rotation@pvalues
rm(mcube_object_1_rotation)
saveRDS(
    pvalues_1_rotation,
    file = file.path(
        RESULT_PATH, "visium_1",
        paste0("pvalues_rotation", ".rds")
    )
)
mcubeKernel: length_scale is set as 0.101059327818091 for the Gaussian kernel.

mcubeKernel: length_scale is set as 0.142919472004653 for the Gaussian kernel.

mcubeKernel: length_scale is set as 0.101059327818091 for the Gaussian_transformed kernel.

mcubeKernel: length_scale is set as 0.142919472004653 for the Gaussian_transformed kernel.

Number of physical cores: 72.

Number of workers: 70.

Number of thread(s) on BLAS per worker: 1.
Visium Slice 2
[6]:
# reference_ST <- data.matrix(read.csv(
#     file.path(DATA_PATH, "visium_2", "reference_ST.csv"),
#     header = TRUE, row.names = 1, check.names = FALSE
# ))
# dim(reference_ST)
# num_celltypes <- nrow(reference_ST)

# proportions_ST <- data.matrix(read.csv(
#     file.path(DATA_PATH, "visium_2", paste0("prop_slice", 0, ".csv")),
#     header = TRUE, row.names = 1, check.names = FALSE
# ))
# dim(proportions_ST)

# counts <- as.data.frame(readr::read_csv(
#     file.path(DATA_PATH, "visium_2", "counts.csv")
# ))
# rownames(counts) <- counts[, 1]
# counts[, 1] <- NULL
# counts <- data.matrix(counts)
# dim(counts)

# coordinates <- data.matrix(read.csv(
#     file.path(DATA_PATH, "visium_2", "3D_coordinates.csv"),
#     header = TRUE, row.names = 1, check.names = FALSE
# ))[, c("x", "y")]
# dim(coordinates)

# spot_effects_ST <- data.matrix(read.csv(
#     file.path(DATA_PATH, "visium_2", "spot_effects_ST.csv"),
#     header = TRUE, row.names = 1, check.names = FALSE
# ))[, 1]

# library_sizes_ST <- data.matrix(read.csv(
#     file.path(DATA_PATH, "visium_2", "library_sizes_ST.csv"),
#     header = TRUE, row.names = 1, check.names = FALSE
# ))[, 1]
[7]:
# Real case

# mcube_object_2 <- createMCube(
#     counts = counts, coordinates = coordinates,
#     proportions = proportions_ST, library_sizes = library_sizes_ST,
#     covariates = NULL,
#     reference = reference_ST,
#     spot_effects = spot_effects_ST, platform_effects = NULL,
#     project = "mouse_brain_visium_2"
# )
# mcube_object_2 <- mcubeFitNull(
#     mcube_object_2,
#     num_workers = 70, num_threads = 1
# )
# mcube_object_2 <- mcubeTest(
#     mcube_object_2,
#     num_workers = 70, num_threads = 1, shared_memory = TRUE
# )
# saveRDS(
#     mcube_object_2,
#     file = file.path(
#         RESULT_PATH, "visium_2",
#         paste0("mcube", ".rds")
#     )
# )
mcube_object_2 <- readRDS(
    file = file.path(
        RESULT_PATH, "visium_2",
        paste0("mcube", ".rds")
    )
)
[8]:
# Rotate 45 degree

degrees <- 45
coordinates_rotation <- mcube_object_2@coordinates %*% rotation_matrix_2d(degrees)
rownames(coordinates_rotation) <- rownames(mcube_object_2@coordinates)
mcube_object_2_rotation <- mcube_object_2
mcube_object_2_rotation@coordinates <- coordinates_rotation

mcube_object_2_rotation <- mcubeTest(
    mcube_object_2_rotation,
    num_workers = 70, num_threads = 1, shared_memory = TRUE
)
pvalues_2_rotation <- mcube_object_2_rotation@pvalues
rm(mcube_object_2_rotation)
saveRDS(
    pvalues_2_rotation,
    file = file.path(
        RESULT_PATH, "visium_2",
        paste0("pvalues_rotation", ".rds")
    )
)
mcubeKernel: length_scale is set as 0.104577495815249 for the Gaussian kernel.

mcubeKernel: length_scale is set as 0.147894912900941 for the Gaussian kernel.

mcubeKernel: length_scale is set as 0.104577495815249 for the Gaussian_transformed kernel.

mcubeKernel: length_scale is set as 0.147894912900941 for the Gaussian_transformed kernel.

Number of physical cores: 72.

Number of workers: 70.

Number of thread(s) on BLAS per worker: 1.
Comparing the results before and after rotation
[9]:
# pvalues_1_rotation <- readRDS(
#     file = file.path(
#         RESULT_PATH, "visium_1",
#         paste0("pvalues_rotation", ".rds")
#     )
# )
# pvalues_2_rotation <- readRDS(
#     file = file.path(
#         RESULT_PATH, "visium_2",
#         paste0("pvalues_rotation", ".rds")
#     )
# )
[10]:
pvalues_plot_df <- rbind(
    data.frame(
        merge(
            mcubePvalueList2LongTable(mcube_object_1@pvalues),
            mcubePvalueList2LongTable(pvalues_1_rotation),
            by = c("celltype", "gene"),
            suffixes = c("", "_rotation")
        ),
        slice = "Slice 1"
    ),
    data.frame(
        merge(
            mcubePvalueList2LongTable(mcube_object_2@pvalues),
            mcubePvalueList2LongTable(pvalues_2_rotation),
            by = c("celltype", "gene"),
            suffixes = c("", "_rotation")
        ),
        slice = "Slice 2"
    )
)
head(pvalues_plot_df)
| celltype | gene | pvalue | pvalue_rotation | slice | |
|---|---|---|---|---|---|
| <chr> | <chr> | <dbl> | <dbl> | <chr> | |
| 1 | Ext_Hpc_CA1 | 1110051M20Rik | 2.469750e-01 | 3.437970e-01 | Slice 1 |
| 2 | Ext_Hpc_CA1 | 2010300C02Rik | 7.794415e-07 | 2.162494e-08 | Slice 1 |
| 3 | Ext_Hpc_CA1 | 2900026A02Rik | 5.424490e-01 | 5.456476e-01 | Slice 1 |
| 4 | Ext_Hpc_CA1 | 4930402H24Rik | 1.067728e-05 | 8.406705e-06 | Slice 1 |
| 5 | Ext_Hpc_CA1 | 4932438A13Rik | 3.835030e-01 | 5.071124e-01 | Slice 1 |
| 6 | Ext_Hpc_CA1 | Aak1 | 5.320344e-02 | 6.501347e-02 | Slice 1 |
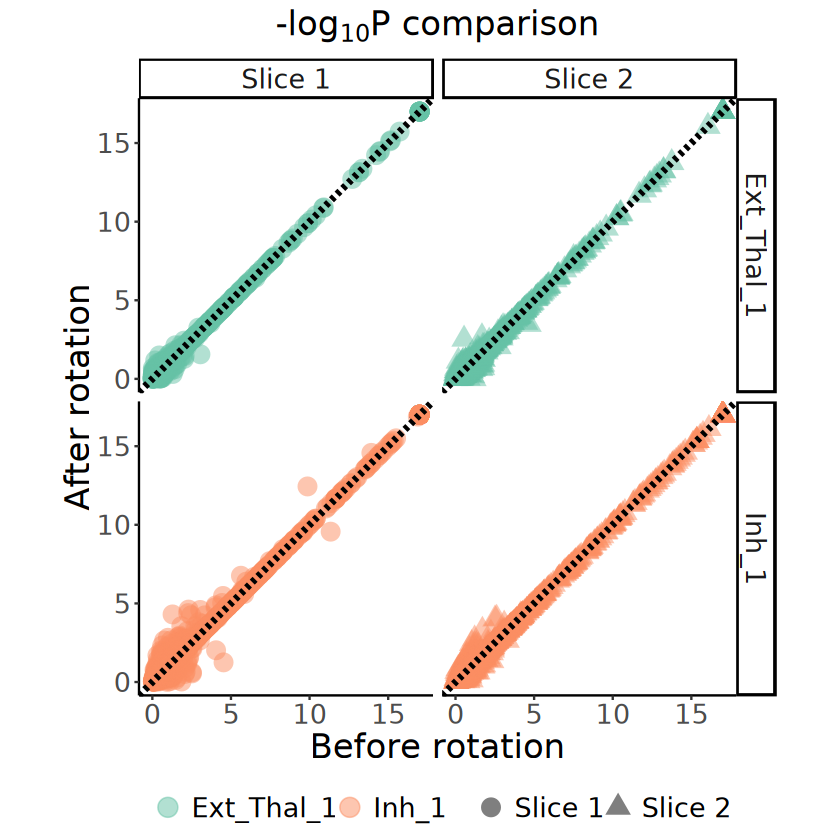
[11]:
demo_celltypes <- c("Ext_Thal_1", "Inh_1")
p <- ggplot(
    data = pvalues_plot_df[pvalues_plot_df$celltype %in% demo_celltypes, ],
    aes(x = -log10(pvalue), y = -log10(pvalue_rotation))
) +
    geom_point(aes(color = celltype, shape = slice), size = 5, alpha = 0.5) +
    scale_color_brewer(palette = "Set2") +
    geom_abline(intercept = 0, slope = 1, linetype = "dashed", color = "black", linewidth = 1.5) +
    scale_x_continuous(limits = c(0, 17), oob = scales::oob_squish) +
    scale_y_continuous(limits = c(0, 17), oob = scales::oob_squish) +
    coord_fixed(ratio = 1) +
    facet_grid(celltype ~ slice) +
    labs(
        x = "Before rotation",
        y = "After rotation",
        title = expression(paste("-log"[10], plain("P"), " comparison")),
    ) +
    theme_classic() +
    theme(
        plot.title = element_text(size = 20, hjust = 0.5),
        axis.title = element_text(size = 20),
        axis.text = element_text(size = 16),
        strip.text = element_text(size = 16),
        legend.title = element_blank(),
        legend.text = element_text(size = 16),
        legend.position = "bottom"
    )
ggsave(
    filename = file.path(
        RESULT_PATH,
        paste0("pvalues_rotation_comparison", ".pdf")
    ),
    plot = p, device = "pdf", width = 8, height = 8
)
p